Showing posts with label Surfer. Show all posts

Sunday, 29 March 2015

How to create a simple Contour Map in Surfer?

Contour Map is a map that shows lines of equal magnitude (like elevation, concentration, precipitation etc.). Contour map for required parameter (Z) can be plotted with respect to coordinate data (X,Y). Different set of contour maps can be plotted if one has multiple Z values for X, Y coordinates.

Uses of Contour Maps

Contour maps are extremely useful in various fields like Meteorology, Environmental science, Physical Geography and Oceanography, Ecology, Social Sciences, Civil Engineering and Geology. In geology contouring is mostly used in structural geology, sedimentology, stratigraphy and economic geology. One of very common example is topographic map where elevation is used to show topography of area. Another example is Isopach maps to illustrate variations in thickness of geologic units. An example of simple contour map is given below -
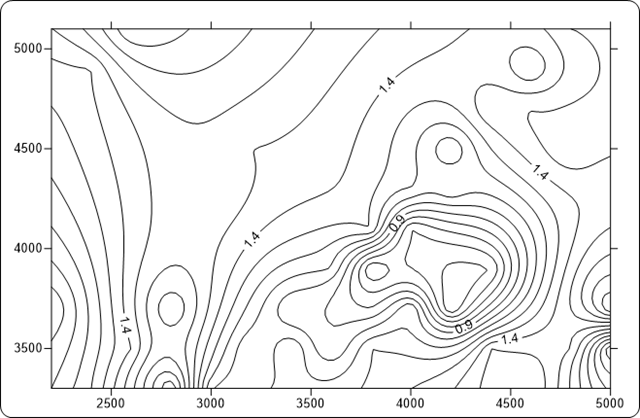
Simple Contour
In Surfer contour map can be prepared based on a grid file. We have already discussed about grid file creation.
If you already well versed with Grid file creation then you can download Demo Grid file for practice.
Download grd
To create contour map one has to perform following steps:
Step 1: Click the Map ↦ New ↦ Contour Map command, or click the button contour_icon in the map toolbar. Then Open Grid dialog will be displayed.
2.1
Step 2: Select the grid file you created in previous tutorial (Demo Data.grd) by clicking once on its name. The file name is entered in the File name box.
2.2
Step 3: Click on Open Button or alternatively Double Click on file name.
Step 4: In the Assign Coordinate System dialog, accept the default Unreferenced local system and click OK. The map is created using the default contour map properties.
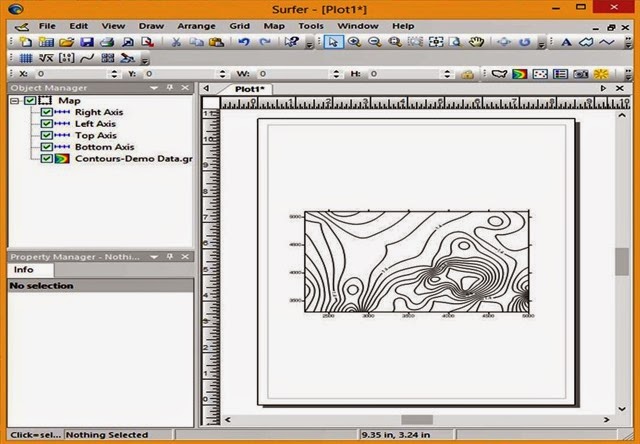
2.3 
Step 5: If you wish to save contour map; by default it will be saved in the same directory in which grid file was present with extension .srf.
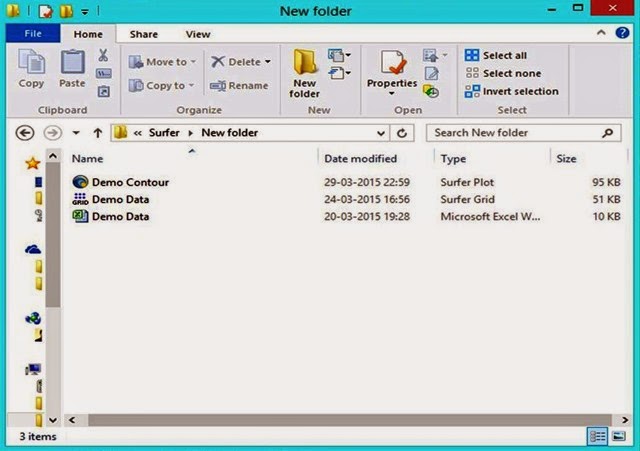
2.4

Sunday, 22 March 2015

How to Create Grid File in Surfer ?

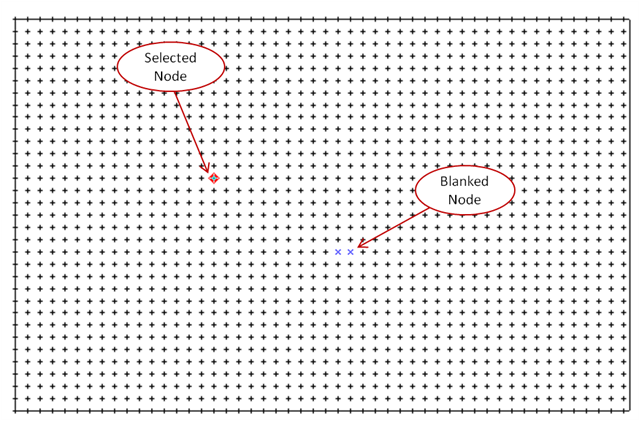
A grid is a series of vertical and horizontal lines that are used to subdivide XY plane into number of blocks. Intersection of vertical and horizontal lines are called Grid Node. Each grid node is represented by a Z value. These rectangular array of Z values are used to generate maps. In Surfer, each grid node is indicated with a "+" in the grid editor window. Each blanked node is indicated with a "x" in the grid node editor. The selected grid node is displayed with a red diamond around the grid node.
surfer 7
To prepare Grid File in Surfer one has to do these five steps.
Step 1: Go to your Desktop or Start Menu click on Surfer icon surfer_icon . Following dialog box will be open by default.
Surfer 1
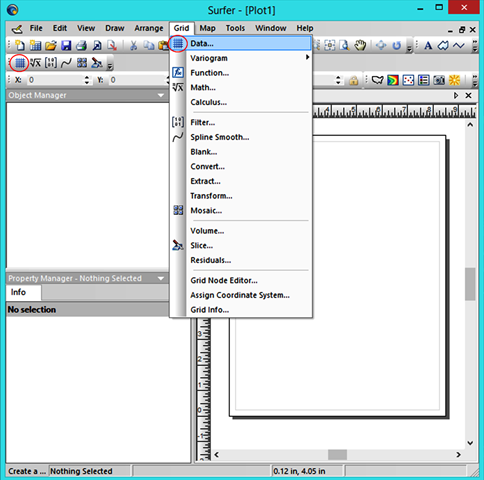
Step 2: Now locate Grid menu in top Menu Bar and click on Data. Alternatively you can also click on Grid icon Grid Icon.

Surfer A
Step 3: After clicking; Open Data dialog box will be opened that is to load the data. If you are in the right directory then simply select data file and click open button. Otherwise use windows explorer to locate your data file and load the data. For tutorial  purpose a data file Demo Data has been prepared.
You can download format of data file from here Download Demo Data File.
 Picture11
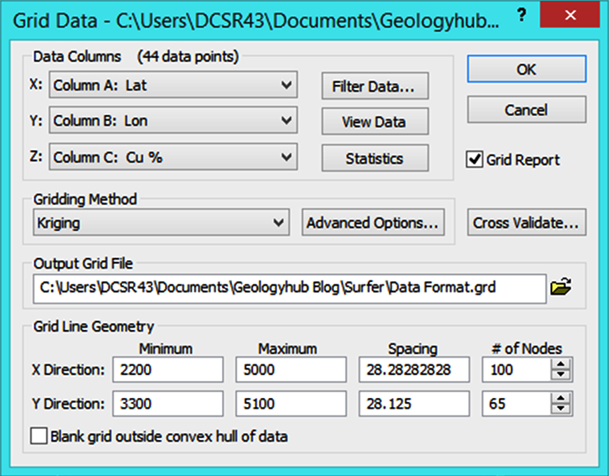
Step 4: After clicking on Open button Grid Data dialog box will be opened. The Grid Data dialog allows you to control the gridding parameters.

Surfer 4
Here you will see following options-
  • The Data Columns section is used to specify the columns containing the X and Y coordinates, and the Z values in the data file.
  • The Filter Data button is used to filter your data set.
  • The View Data button is used to see a worksheet preview of your data.
  • The Statistics button is used to open a statistics report for your data.
  • The Grid Report option is used to specify whether to create a statistical report for the data.
  • The Gridding Method option is used to specify the interpolation gridding method.
  • The Advanced Options button is used to specify advanced settings for the selected Gridding Method.
  • The Cross Validate button is used to assess the quality of the gridding method.
  • The Output Grid File displays the path and file name for the grid file.
  • The Grid Line Geometry section is used to specify the XY grid limits, grid spacing, and number of grid nodes (also referred to as rows and columns) in the grid file.
  • The Blank grid outside convex hull of data automatically blanks any locations that are outside the data area.
  • Click OK. By accepting the defaults, the grid file uses the same path and file name as the data file, but the grid file has a .GRD extension.
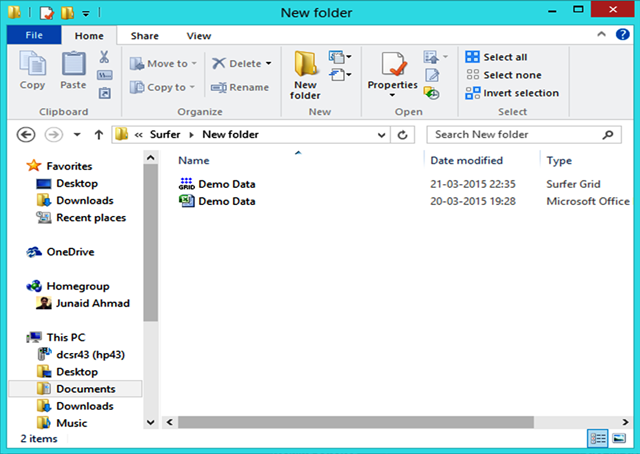
Step 5: By default, a Surfer dialog appears after gridding the data with the full path and file name of the grid file that was created. Click OK in the Surfer dialog. The Demo Data.grd grid file is created.

Picture1b
If Grid Report was checked in the Grid Data dialog, a report is displayed. You can minimize or close this report. This report contains detailed information about the gridding process.

Tuesday, 17 March 2015

A Breif Introduction to Surfer


About Surfer

Surfer is a grid-based mapping program that interpolates irregularly spaced XYZ data into a regularly spaced grid. Grids may also be imported from other sources. Surfer uses these grid files to produce different types of maps. Different methods of gridding (like Kriging, Nearest Neighbor, Minimum Curvature, Inverse distance to a power and many more ... ) and mapping options are available allowing you to produce the map that best represents your data. In addition, data metrics allow you to gather information about your gridded data in the form of report. The grid files themselves can be edited, combined, filtered, sliced, queried, and mathematically transformed.

What for Surfer can be used ?

Frankly speaking Surfer is one of the best and robust package when it comes in preparation of contour diagram. Surfer basically interpolates a Z data that may be elevation, assay value, stratum thickness, grade etc. spaced in XY plane (e.g. Easting & Northing). The following output can be generated from Surfer.
  • A contour diagram for XYZ data.
  • Prepare 3-D Wireframe for XYZ data.
  • Can create Base Map from XY data.
  • Create watershed map types that calculate and display drainage areas and watershed boundaries.
  • Create profiles automatically from map layers.
  • Can create 3-D Surface map.
  • Can create Post map for overlay purpose.
  • Shaded Relief Map can be created.
  • Can create Grid Vector Map.

Conclusion

Surfer is a powerful and user friendly package for Geology. Here one can play with polyline and polygon. Polyline can be converted in polygon and vice versa. Polygons can be combined together to a single polygon. Data can be imported in Excel, GPX, ASCII, and GRIB formats. It can also import attribute information from files that contain attributes, such as TIF, GPX, or SHP. Files can be exported in Image, PDF, BLN, BNA, GSB, GSI, KML, KMZ, MIF, and SHP file formats. Symbols, texts, scale bar, direction, legend, colour scale etc. can be incorporated to enhance the map presentation.